Huge discrepancy between results with ENDF-B 8.0 and 8.1

Greetings everybody, nice to meet you all!

I was doing a pin-cell depletion simulations, whose geometries follow AP1000 specification. The fuel is consisted of ThO2, U233 oxide, and some Pa231 oxide. First I used the cross-sections and depletion chains libraries provided by openmc.org, but then I downloaded myself the latest ENDF 8.1 library and installed NJOY 2016.78, and then converted them to the cross-sections hdf5 library using openmc.Data and njoy.

I then ran the same simulation with the freshly-compiled ENDF 8.1 library while reusing the previously used depletion chain xml file. To minimized uncertainties I use CF4 algorithm with timestep=90 days, settings.particles=5000, and 150 batches with 20 inactives.

For the library compilation I followed [the documentation]. (3. Data Configuration — OpenMC Documentation). I also compile the S(\alpha,\beta) data for H in H2O from ENDF’s thermal_scatt sublibrary (it’s 2.6gb, so big…).

This is the k-eff for 3600 days:

I know that different cross-sections data will lead to different result, but is the results above normal? It’s almost as if ENDF-B 8.1 has nothing to do with 8.0, I fear I made a mistake in my assumptions or procedure.

Thank you!

Edit: I forgot to mention, the light water temperature is 600K, clad temp is 621K, and fuel temp is 900K. Because O16 data for the thermal scatter law is not defined to 600K in the official data, I used settings.temperature = {‘method’ : ‘interpolation’, ‘tolerance’ : 300}

Update: I tallied the absorption rate for the fissile isotope and the (n,gamma) rate for the fissionable isotope in both simulations. This is the result:

I’m not trolling, but this is tripping me. What’s going on??

Hi Wiguna, welcome to the openmc community.
You might want to check the consistency of your nuclear data, but since there are many isotopes in it, you can focus on the isotopes whose concentration bit off.

Have you checked the concentration of some fission product that has high neutron absorption?

If the burnup chain file you used was reporting too many isotopes, you can try to use the simple burnup chain (casl) so it will be easier to trace which isotopes are too much or less than the official endf80.

At first, I think you can compare the material.xml from burnup step #1000 days to see which isotopes affecting your calculated kinf.
From that, we can trace which reaction rate affects the production and consumption of that isotope and then compare your generated endf81 h5 file to the official endf80 h5 file for that reaction rate.

1 Like

Hello @wahidluthfi, thanks for the reply and suggestions!

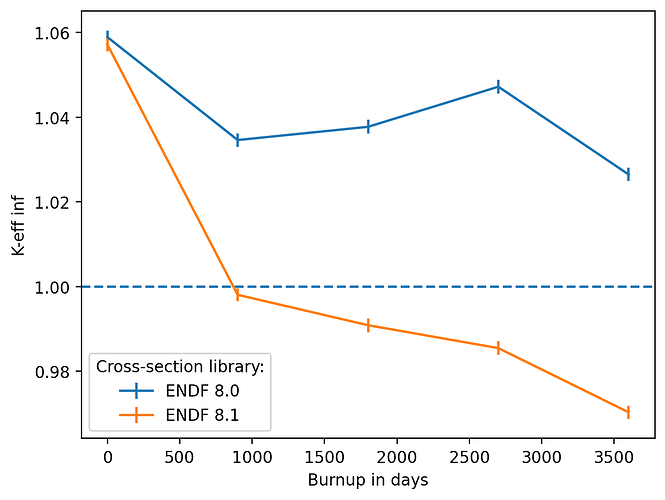
I redo the simulation with CASL simplified chain xml, and for investigative purposes I increased the burnup timestep to 900 (so [900] x 4 days). I then plotted the k-eff infinite plot, and compared the materials.xml between both simulations after 900 and 1800 days, then formatted and sorted them into a list of tuples from the greatest difference to the smallest.

This is the plot:

This is the comparison of materials after 1 timestep (900 days):

This is after 2 timesteps (1800 days):

Apparently both cross-sections data lead to essentially the same burnup chain (notice the deltas are < 2e-6), but somehow the reported keff between both simulations are wildly different. That’s why I’m appalled of how similar the reaction rates between both previous simulations.

As per this time I’ll just stick with the provided ENDF/B-8.0 data for my research.

Thank you!

ps: Here are the .xml files; result{vers}-{timestep}-....xml for vers is the ENDF version, after timestep step:

result80-1-materials.xml (10.6 KB)
result80-2-materials.xml (10.6 KB)
result81-1-materials.xml (10.6 KB)
result81-2-materials.xml (10.6 KB)

ps2: Here is the ENDF/B.VIII.1 that used in the simulation: link

Another update: Last night I run the variation with NpO2 as poison instead of PaO2.
For each material and cross-section library I also varied the concentration of the fissile material and the poison material. Here are the results of k-eff for both poison variations:

Wacky stuff only happened when protactinium is used. I might try to use JEFF library or ENDF/B.VII.0 to pinpoint the culprit of the discrepancy.

Since you already know that the kinf were closely related to the nu fission and absorption, then when you have more/fewer isotopes, it will affect the reaction rate.
In your case, you think that the isotopes of Np237 give your model an additional absorption rate, right? Have you compared the capture xs or abs xs between each library for this element?

extras:
I am also checking your h5 file [7.74 GB (8,318,936,392 bytes)] to the depletion notebook ( openmc-notebooks/depletion.ipynb at develop · openmc-dev/openmc-notebooks · GitHub ) except that I add Th to the fuel mix without changing its density to make it closer to your Th model

fuel = openmc.Material(name="UO2") # +ThO2 / +NpO2 / +PaO2
fuel.add_element("U", 0.5, percent_type="ao", enrichment=4.25)
fuel.add_element("Th", 0.5, percent_type="ao")
# fuel.add_element("U", 0.98, percent_type="ao", enrichment=4.25)
# fuel.add_nuclide("Np237", 0.02, percent_type="ao")
# fuel.add_nuclide("Pa231", 0.02, percent_type="ao")
# fuel.add_element("U", 1, percent_type="ao", enrichment=4.25)
fuel.add_element("O", 2)
fuel.set_density("g/cc", 10.4)

Actually, the k-eff were consistent between endf71, 80 and 81 either when using chain_simple


or chain_casl_pwr

then for another model with Np237 (2%mol) using chain_casl_pwr

while with Pa231 (2%mol) using chain_casl_pwr

I can’t reconstruct that trend with this simple modified depletion case (2% Pa231) but with more depletion days, up to 600 days, I think the discrepancies start to shows

Hi, after read your latest reply I plot the absorption cross-sections between both library using openmc.plot_xs function of the whole burnup-chain scheme for Th232.

For almost all nuclides, the plots are basically the same except for U234 and U236 (blue line for ENDF/B.8.0, orange for 8.1; i hope someday we can modify the axis parameters in plot_xs):


The addition of Np237 is due to my research plan (suggested by my advisor). Here is the k-eff comparison with both libraries (I also test ENDF/B.7.1 and JEFF 3.3). I also use chain_simple to decrease the computational cost.

It’s normal as expected:

Cannot say the same for Pa231 addition:

For the record, the simulation with Pa231 and Np237 codes are basically identical, except I change “Pa231” to “Np237”.

Is there any relationship between the labeling of ‘thermal’ and ‘fast’ in the cross-section listed on openmc.org with the anomaly when Pa231 is added?

Until that time, you can do something like this:

ax = plt.gca()
lines = ax.get_lines()
labels = ["ENDF/B-8.0", "ENDF/B-8.1"]
ax.legend(lines, labels)
2 Likes

Whoa, thank you for the tips! It’s very helpful :grin:

Update: I know that absorption is not an issue now, for this is the fuel cell absorption tally:

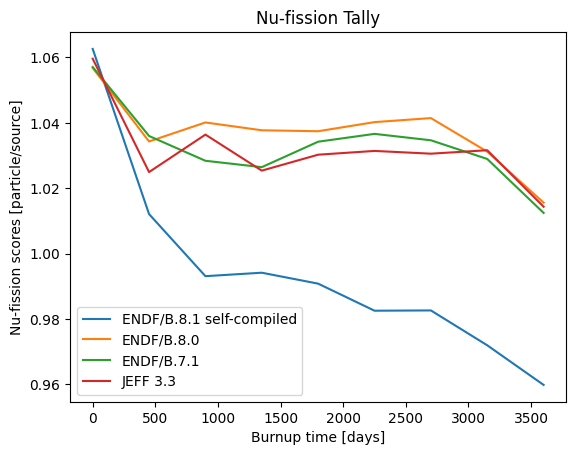
Therefore I investigate a bit more into this. I tally the nu-fission rate of the fuel cell. This is the result:

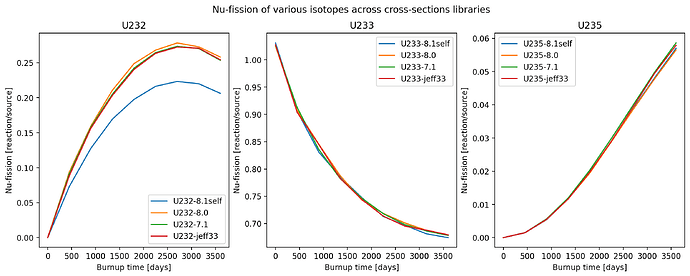
Nu-fission is the total production of neutron per fission reaction. Here are the scores for different nuclide in the fuel:

It differs on U232, and that difference is enough to drown the keff.

Quod erad demonstratum :smiley:

Thank you for the help these past days, @wahidluthfi

Best regards,
Chris

1 Like

That a good finding that the nubar of U-232 was changed significantly in endf/VIII.1 and it has a considerable impact on your case scenario. I didn’t consider that isotope since the release note didn’t mention U232.

But after checking both endf files, endf81 has noted that the prompt neutron per fission (nubar prompt MT 456) was updated so that the total neutron per fission (nubar total MT 452) has been recalculated

I also tried to run my dummy depletion test with endf81 except that I changed the U232.h5 to use the h5 file from endf80, and the calculation was in good agreement (shown in black line) to endf80 and endf71,

The next problem may be validating nuclear data since this has an impact on some cases with substantial U232 in the core, which came from the use of Pa231 in your cases, increasing the production of U232.
You might want to ask “Which nuclear data can be used for my calculation?” later. But sorry, I haven’t done benchmark cases that use a significant amount of U232, so I can’t give any recommendations to benchmark this nuclear data.

Hello @wahidluthfi,

I think benchmarking them itself is worthy of its own paper. I believe there is another aspect that’s still missing, of why in some cases the differences is pretty much negligible, and in other cases the differences are huge.

A very important note is that U232 in my case are probably mainly produced by the addition of Pa-231 (Pa-231 (n,g)–> Pa-232 (beta)–> U-232)

The Th232 are mainly transmuted into Th-233 → Pa-233 → U-233. It’s based on the burnup scheme by Kannan and Singh (2023) (DOI: 10.1007/s41403-024-00465-8)

Sorry, I am typing Th231 when thinking about Pa231 used in your case scenario. My bad.

1 Like