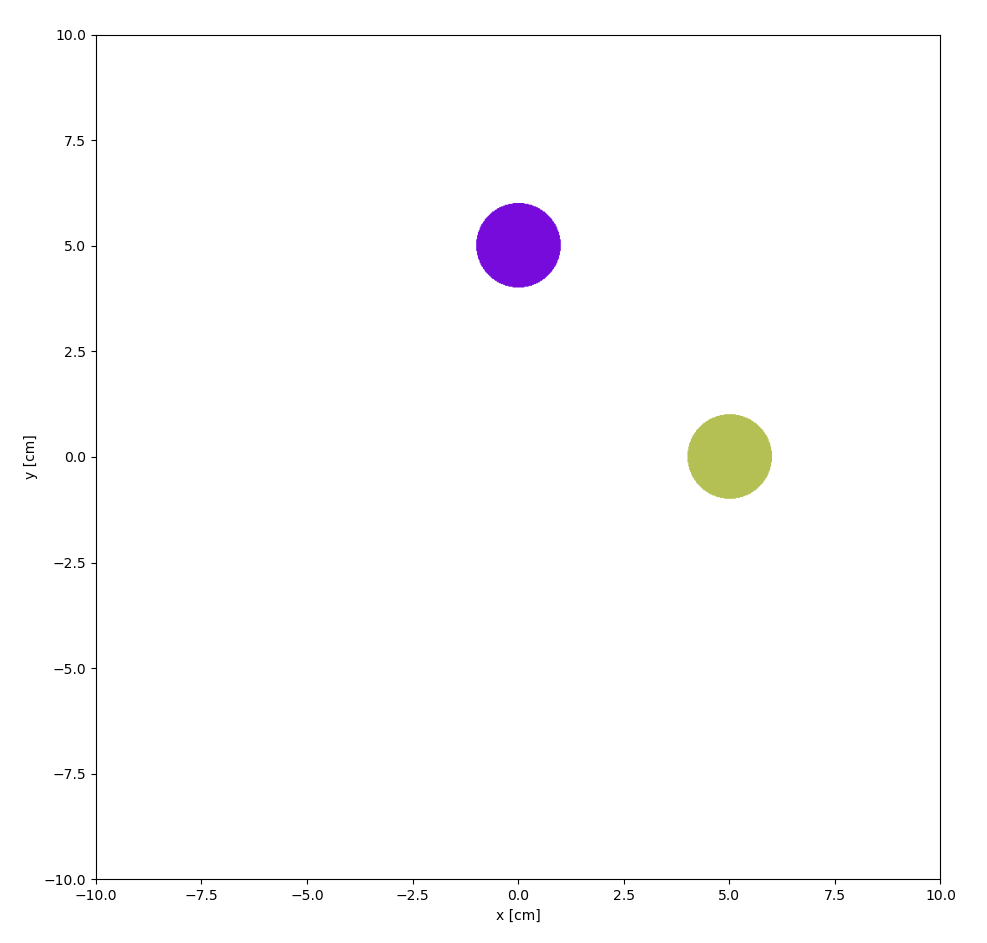
Hello, I’m trying to understand the behavior of cloning and rotating. In this simple example I can only visualize the original cell, and the first rotated cell at most. Ideally I would like to see all cells together in one plot. Any help would be much appreciated!
import openmc
import matplotlib.pyplot as plt

spheres = []

sphere_surface = openmc.Sphere(x0=5.0, y0=0, z0=0, r=1.0)

sphere_region = - sphere_surface
sphere_cell = openmc.Cell(region=sphere_region)
spheres.append(sphere_cell)

cloned_sphere = sphere_cell.clone()
universe = openmc.Universe(cells=[cloned_sphere])

rotated_sphere_1 = openmc.Cell(fill=universe)
rotated_sphere_1.rotation = [0, 0, 90]
spheres.append(rotated_sphere_1)

cloned_sphere = sphere_cell.clone()
universe = openmc.Universe(cells=[cloned_sphere])

rotated_sphere_2 = openmc.Cell(fill=universe)
rotated_sphere_2.rotation = [0, 0, 180]
spheres.append(rotated_sphere_2)

print(spheres)

geometry = openmc.Geometry(root=spheres)
geometry.plot(
    basis='xy',
    origin=[0,0,0],
    width=[20, 20],
    pixels=[1000, 1000],
)
plt.show()
If I print the cells, this how they look like:
[Cell
        ID             =        1
        Name           =
        Fill           =        None
        Region         =        -1
        Rotation       =        None
        Translation    =        None
        Volume         =        None
, Cell
        ID             =        3
        Name           =
        Fill           =        1
        Region         =        None
        Rotation       =        [ 0  0 90]
        Translation    =        None
        Volume         =        None
, Cell
        ID             =        5
        Name           =
        Fill           =        2
        Region         =        None
        Rotation       =        [  0   0 180]
        Translation    =        None
        Volume         =        None
]
