yrrepy
April 6, 2023, 9:27pm
1
Hello,
in the OpenMC executable geometry plotter (openmc --plot)
The Python openmc-plotter can.
Cheers,
Hey @yrrepy . Yes, those thick black outlines are quite snazzy in the openmc-plotter. That was a feature that @pshriwise had added and it’s based on the Axes.contour method in matplotlib:
          def add_outlines(self):
              cv = self.model.currentView
              # draw outlines as isocontours
              if cv.outlines:
                  # set data extents for automatic reporting of pointer location
                  data_bounds = [cv.origin[self.main_window.xBasis] - cv.width/2.,
                                 cv.origin[self.main_window.xBasis] + cv.width/2.,
                                 cv.origin[self.main_window.yBasis] - cv.height/2.,
                                 cv.origin[self.main_window.yBasis] + cv.height/2.]
                  levels = np.unique(self.model.ids)
                  self.contours = self.ax.contour(self.model.ids,
                                                  origin='upper',
                                                  colors='k',
                                                  linestyles='solid',
                                                  levels=levels,
                                                  extent=data_bounds)
Unfortunately that’s not a feature in our regular plotting capability at present.
With a bit of tinkering you can get outlines on a variation of the Openmc executable plot.
import numpy as np
import matplotlib.pylab as plt
import openmc
import openmc_geometry_plot  # adds functions to openmc.Geometry
from matplotlib import colors
import matplotlib.patches as mpatches

# MATERIALS

mat1 = openmc.Material()
mat1.set_density("g/cm3", 1)
mat1.id = 1
mat1.add_element("Pb", 1)

mat2 = openmc.Material()
mat2.id = 2
mat2.set_density("g/cm3", 1)
mat2.add_element("Fe", 1)

mats = openmc.Materials([mat1, mat2])
show original
@yrrepy this pull request which attempts to add outlines to the plot method in openmc might be of interest
openmc-dev:develop ← shimwell:adding_outlines_to_plot
opened 02:24PM - 17 Apr 23 UTC
This PR attempts to add outlines to the universe.plot method.
I had this func… tionality over in the [openmc-geometry-plot](https://github.com/fusion-energy/openmc_geometry_plot) package and thought it would be much better over here :recycle:
Also inspired by @gridley and @pshriwise recent [PR](https://github.com/openmc-dev/openmc/pull/2472) which improves the universe plot method.
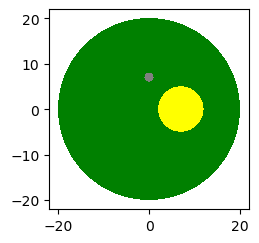
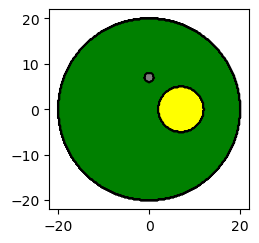
before this PR

after this PR using optional ```outline```

Minimal script for using this ```outline``` feature
```python
import openmc
from matplotlib import pyplot as plt
mat_iron = openmc.Material()
mat_iron.name= 'iron'
mat_iron.add_element("Ni", 1.0)
mat_iron.set_density("g/cm3", 1)
mat_aluminum = openmc.Material()
mat_aluminum.add_element("W", 1.0)
mat_aluminum.set_density("g/cm3", 19.3)
sphere_surf_1 = openmc.Sphere(r=20, boundary_type="vacuum")
sphere_surf_2 = openmc.Sphere(r=1, y0=7)
sphere_surf_3 = openmc.Sphere(r=5, x0=7)
sphere_cell_1 = openmc.Cell(region=-sphere_surf_1 & +sphere_surf_2 & +sphere_surf_3)
sphere_cell_2 = openmc.Cell(region=-sphere_surf_2)
sphere_cell_3 = openmc.Cell(region=-sphere_surf_3)
sphere_cell_3.name= 'sphere_cell_3'
sphere_cell_2.fill = mat_iron
sphere_cell_3.fill = mat_aluminum
my_materials = openmc.Materials([mat_iron, mat_aluminum])
all_cells = [sphere_cell_1, sphere_cell_2, sphere_cell_3]
universe = openmc.Universe(cells=all_cells)
mat_colors = {
my_materials[0] : 'green',
my_materials[1] : 'gray'
}
cell_colors = {
all_cells[0] : 'green',
all_cells[1] : 'gray',
all_cells[2] : 'yellow'
}
universe.plot(
# legend=True,
width=(44, 44),
origin=(0., 0., 0.),
outline=True,
colors=cell_colors,
color_by='cell'
)
plt.savefig("plot_cell.png", bbox_inches="tight")
universe.plot(
# legend=True,
width=(44, 44),
origin=(0., 0., 0.),
outline=True,
colors=mat_colors,
color_by='material'
)
plt.savefig("plot_material.png", bbox_inches="tight")
```
1 Like
yrrepy
April 17, 2023, 4:20pm
5
Awesome,